Performance Analysis and Optimization of A-Buffer Antialiasing

It's performance analysis and optimization time! Truthfully, this is one of my favorite parts of any project. Most of the time it ends up being a very rewarding experience. Although ironically it's rewarding inversely to how clever you were when you originally wrote your code. If the code is already fast, it can be a frustrating time. Not so today, as you'll see!
I'm going to be looking at the performance of the code from my last post. I had a few comments wondering how fast the code was, and specifically the question of whether it would be faster to calculate the mask, or look it up in a table due to the possibility of L2 cache misses. So I was interested in trying out that change to see if it went any faster. But before that, I needed to establish my baseline performance.
Testbed
I created some test code to run the algorithm. Rather than making it a "normal" case, I wanted to make it somewhat pathological to really push the coverage code. So I created a 100 x 100 pixel grid with a polygon composed of 100 edges randomly spaced over the grid. This results in massive self-intersection with each edge covering a large number of scanline rows, and each row intersecting a large number of edges. It ends up putting 52% of the pixels into "complex" mode. i.e. 52% of pixels actually need to calculate A-Buffer coverage. In my rotoscope tool, edges would normally take up only a tiny percentage of the screen. Even if the poly covered 90% of the screen, the percent of pixels undergoing A-Buffer coverage testing would normally be well less than 1%, so this is certainly not a representative test, but it really pushes the one area I want to test: The A-Buffer coverage code.
At every stage I calculated a hash of the resultant image, so that I could make sure that it was still identical to my known-good initial reference code. If the hash ever changed, I'd know that my optimization introduced some sort of error into the calculation. Basically it was a unit test.
I ran each test 50 times, removing the slowest outliers and averaging the results.
Analysis
My first run resulted in a timing of 96.3 ms. Honestly, this was disappointing. My background has been primarily in game development and any rendering step that takes more than a few milliseconds is considered slow. To be fair, we're talking software rendering here, not hardware, and even though it's low resolution, the 100 edges with heavy self-intersection do result in effectively many thousand on-screen anti-aliased triangles. The A-Buffer algorithm was originally built for cinematic pipelines where rendering times were in the hours. But enough excuses. This is 2015 and we can do much better than 96 ms, even in a pathological test case, especially if interactivity is our goal.
Once again, here's the core algorithm for filling a row:
void fillRow(int y, int x, int r, float * data, const ABufferMaskLibrary & abufferMaskLibrary) {

    std::vector<Vector2> clippedCurve;
    std::vector<char> complex;
    complex.resize(r);

    clipCurveToRow(kInner, x, y, complex, clippedCurve);

    bool calculateCoverage = true;
    float currentCoverage = 0.0f;
    for (int px = x; px < r; ++px) {
        bool isComplex = complex[px] != 0;
        // If the current cell isn't simple, we need to calculate it.
        calculateCoverage |= isComplex;

        if (calculateCoverage) {
            // Calculate the A-Buffer coverage for this cell.
            std::vector<Vector2> pts1;
            std::vector<Vector2> pts2;
            clipToX((float) px,        -1.0f, clippedCurve, pts1);
            clipToX((float) px + 1.0f, +1.0f, pts1, pts2);
            currentCoverage = applyABuffer(abufferMaskLibrary, (float)px, (float)y, pts2);

            // Our coverage can be used in the next pixel only if this pixel is simple
            calculateCoverage = isComplex;
        }

        // Apply the coverage to the pixel
        if (currentCoverage != 0) { // Only do this logic if there's something to apply
            float val = data[px];
            val += currentCoverage;
            if (val > 1.0f)
                val = 1.0f;
            data[px] = val;
        }
    }
}
So my first test was to remove the "complex" processing (the section inside of if (calculateCoverage)) : i.e. still clip to the rows, and iterate over all the pixels, but remove the final clipping to the pixel, and the A-Buffer coverage estimation. What we get is 2.6ms. So that's basically pretty close to our minimum. We could optimize what's left, but it's obviously not our main problem.
So let's put back the final clipping step but comment out the applyABuffer() line.
The result is 90.5 ms.
So that tells us that the applyABuffer() line is taking around 96.3 - 90.5 ms = 5.8 ms, and the final 2 lines that clip the edges to the pixel are taking roughly 90.5 - 2.6 ms = 87.9 ms. Those clipping steps are horrible! Before we even think about the mask calculation and table lookup, we need to do something about that.
Let's first consider what we need really to clip against. The first clip is for the left edge of the pixel and the second clip is for the right. But as we move to the right across the scanline, each successive pixel is going to reject more and more edges. And that reduced edge list is also going to be valid for each pixel to the right of it. So let's save the results from the left edge calculation and use them as the starting point for the next pixel:
void fillRow(int y, int x, int r, float * data, const ABufferMaskLibrary & abufferMaskLibrary) {
    std::vector<Vector2> clippedCurve1;
    std::vector<Vector2> clippedCurve2;
    std::vector<Vector2> * currentCurve = &clippedCurve1;
    std::vector<Vector2> * otherCurve = &clippedCurve2;
    ...
    for (int px = x; px < r; ++px) {
       ....
       if (calculateCoverage) {
            ...
            clipToX((float) px,        -1.0f, *currentCurve, *otherCurve);
            clipToX((float) px + 1.0f, +1.0f, *otherCurve, pts2);
            std::swap(currentCurve, otherCurve);
            ...
After that optimization, we're seeing 28.5 ms. Big wins! That's a 3x optimization without much effort. It's a 4x optimization of the specific code we were actually trying to speed up.
Next it's time to look into clipToX() itself. This is a simplified Sutherland-Hodgman algorithm. I already detailed how it worked in my previous post, but I did find some small savings here. Specifically, I took these lines:
Vector2 current = ptsIn[i];
Vector2 previous = ptsIn[j];
which fed into lines like these:
float py1 = (current.y + (previous.y - current.y) * (x - current.x) / (previous.x - current.x));
and I changed them to:
float cx = ptsIn[i].x;
float cy = ptsIn[i].y;
float px = ptsIn[j].x;
float py = ptsIn[j].y;

float py1 = (cy + (py - cy) * (x - cx) / (px - cx));
This brought it down to 27.1 ms. So, a 1.4 ms win. Not bad, but not something to write home about quite yet.
Going back to fillRow(), I noticed something that I really should have seen earlier:
    for (int px = x; px < r; ++px) {
       ....
       if (calculateCoverage) {
            std::vector<Vector2> pts2;
            pts2.reserve(8);
Well, I guess I thought I was being clever to reserve 8 elements in that vector, but the real problem is that the vector is inside the for loop. That's going to be a lot of memory allocation and deallocation for each pixel. Let's move it outside the for loop and reserve 32, just to be safe.
    std::vector<DD::Image::Vector2> pts2;
    pts2.reserve(32);

    for (int px = x; px < r; ++px) {
Another huge win! We're now down to 12.9 ms (7.2 ms if you remove the A-Buffer lookup). It's still just shy of nearly 6 ms to do the table lookup and final coverage calculation. But at least 5.7 ms is a large chunk of our 12.9 ms and a worthy candidate for analysis at this point.
Table vs Code?
We could definitely go further with the clipping optimization, but it's time to actually answer the question we came here for: Is it faster to look up the mask, or calculate it?
Before we answer that, here's our current code for mask lookup:
uint64_t getMask(int p1x, int p1y, int p2x, int p2y) {
    uint16_t index = p1x * (9 * 9 * 9) + p1y * (9 * 9) + p2x * 9 + p2y;
    return masks[maskIndex];
}
And here's the mask calculation code that we'd like to compare it with.
inline uint64_t calculateMask(float p1x, float p1y, float p2x, float p2y)
{
    uint64_t mask = 0;
    if (p1y > p2y) {
        std::swap(p1y, p2y);
        std::swap(p1x, p2x);
    }

    for (int y = (int)p1y; y < (int)p2y; ++y) {
        float ty = 0.5f + (float)y;
        float py = (ty - p1y) / (p2y - p1y);
        float px = p1x + (p2x - p1x) * py;
        int ix = (int) (px + 0.5f);
        uint8_t lineMask = ~((1 << (ix)) - 1);
        uint64_t fullLineMask = lineMask;
        fullLineMask <<= (8ULL * y);
        mask = mask | fullLineMask;
    }

    return mask;
}
Will L2 cache misses slow us down to the extent that the calculation is actually faster? Let's find out. Running the test, the result is 14.9 ms. So with the calculateMask() code as written, it's 2 ms slower than table lookup. So in this case table lookup is definitely still faster, at least for now.
It's possible that we can optimize calculateMask() further, but it's getting a lot harder. At this level the compiler can probably optimize your code better than you can. For example, I tried the obvious: pulling out p2x-p1x and p2y-p1y into their own variables outside of the loop, but it made no difference. The compiler had already done that internally. Probably the only wins we'll get here are algorithmic: if we can figure out to accomplish the same thing using less math. But at this point nothing is immediately obvious.
Well, enough of that digression, let's dig further!
Tool-driven Analysis
It's time to run do a performance analysis tool run on the code:
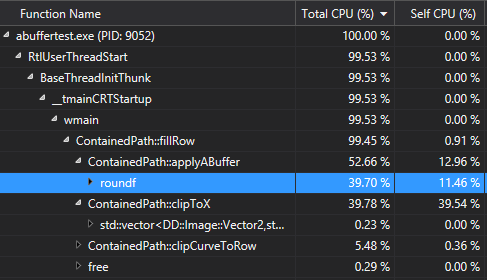
Whoops! Looks like I was being lazy and threw in a round() instead of (int)(value + 0.5f).
It turns out my quantization to the grid was doing this for X and Y:
int p1x = (int) round((clippedVerts[i].x - x) * 8.0f);
So let's change it to this:
int p1x = (int) ((clippedVerts[i].x - x) * 8.0f + 0.5f);
Now, I expect that won't work as well with negative values, but our scanline pixels are always 0 or greater in X and Y. Let see the results...
7.9 ms!
And let's take a look at that performance analysis again:
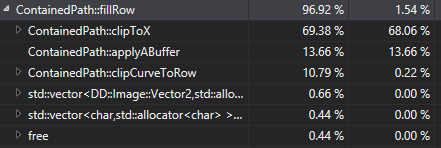
So we've got 11% of the time spent in clipping to the scanline, 70% in clipping to the pixel, and 13.6% applying the A-Buffer. If we were going to do any more optimization at this point, we'd best spend that time in clipToX() or take a look at the algorithm at a higher level to see if we can do less clipping, but at this point I'm going to call it day for this optimization pass.
Conclusion
We brought it down from 96.3 ms to 7.9 ms, a 12x speedup, using a variety of optimizations, some of which were more obvious than others. We also answered our original question as to whether the table lookups would be more expensive than actually doing the straight calculation (answer: No, but it's fairly close).
Donald Knuth's old adage that "premature optimization is the root of all evil" is certainly true, but that doesn't mean we should put it off forever. Hopefully I've shown that surprisingly large wins can be often gained from code that may even seem relatively efficient at first glance.